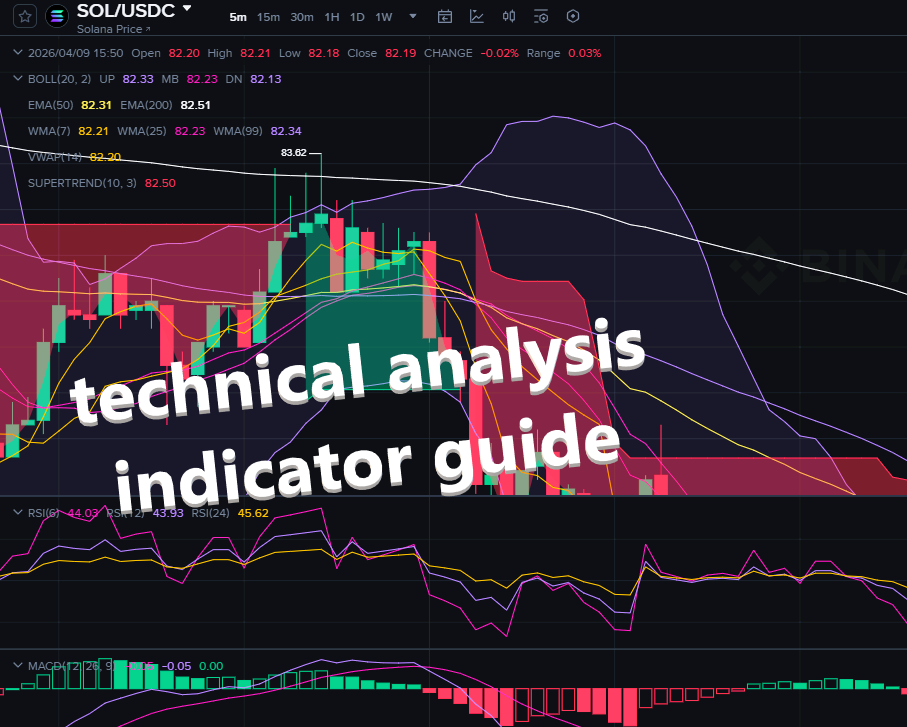
CRYPTO TECHNICAL ANALYSIS INDICATOR GUIDE
The Signal Scanner runs up to 27 technical indicators simultaneously on every pair you scan. This guide explains each one in the exact order they appear in the app — what it measures, how to read it, typical parameter settings, and how to combine it with others for stronger signals.
DOWNLOAD TA SIGNAL SCANNER: https://cryptobots.dev/scripts/technical-analysis-signal-scanner-free/
STARTERS GUIDE: https://cryptobots.dev/articles/signal-scanner-starters-guide
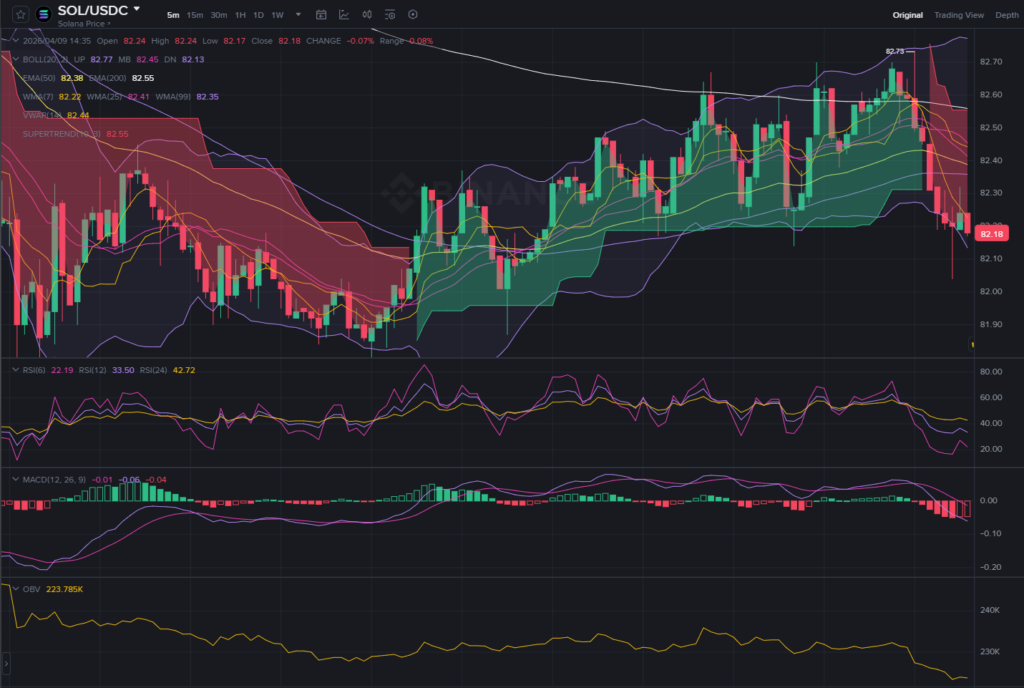
Does this look familiar (and confusing?)
How Scoring Works
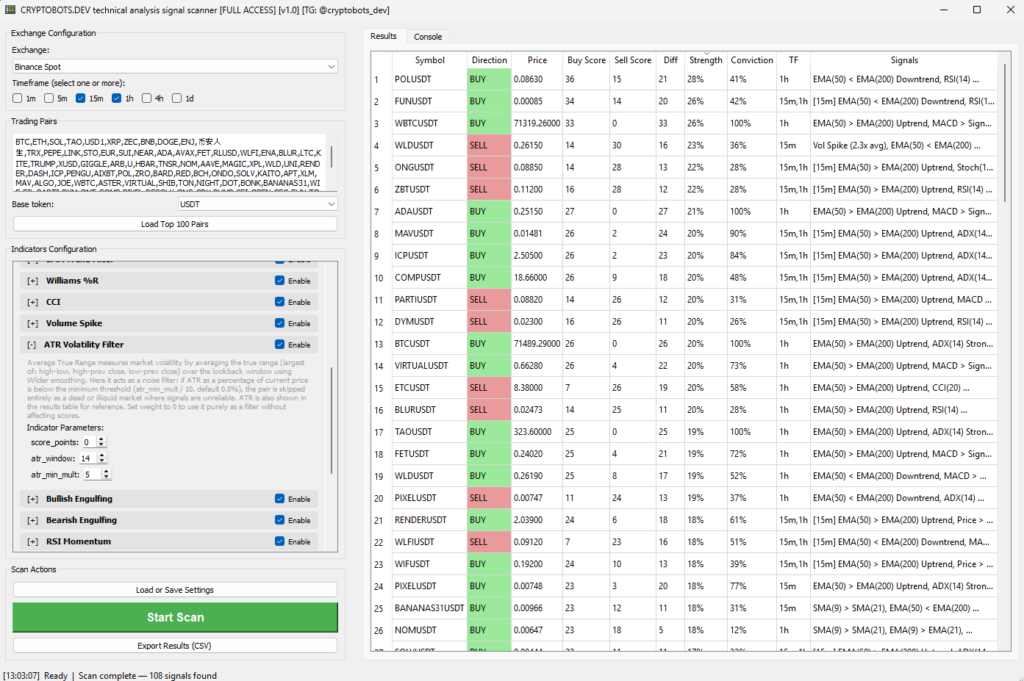
Before diving into individual indicators, here’s the key concept: every indicator has a weight (how many points it contributes when it fires) and a direction (BUY, SELL, or both). When a scan runs, the scanner adds up all fired weights into a BUY score and a SELL score. The side with the higher score wins, and the result is ranked by Strength% — what percentage of available buy (or sell) firepower actually fired.
You can change any weight, enable or disable any indicator, and adjust parameters directly in the app. Everything below reflects the default settings, example in the image below:
🔀 Trend & Moving Average Indicators
1. SMA Crossover
Default weight: 4 | Direction: BUY + SELL | Default params: Short 9, Long 21
A Simple Moving Average (SMA) is the plain average of closing prices over N candles. The SMA Crossover fires when the short-period SMA crosses the long-period SMA.
- BUY signal: Short SMA crosses above Long SMA — recent prices are outpacing the longer average, momentum is building upward
- SELL signal: Short SMA crosses below Long SMA — recent price action is weakening relative to the longer average
SMAs apply equal weight to every candle in their window, making them slower to react than EMAs. This makes the SMA Crossover better at confirming established trends than catching exact reversals.
Best used on: 1h and above. Lower timeframes produce too many false crossovers in ranging markets.
Combine with: EMA Crossover (faster confirmation), ADX Strong Trend (filter out ranging conditions)
2. EMA Crossover
Default weight: 5 | Direction: BUY + SELL | Default params: Short 9, Long 21
An Exponential Moving Average (EMA) applies more weight to recent candles, making it faster than SMA to respond to price changes. Same crossover logic — short crosses above long = BUY, below = SELL.
Because EMA reacts faster it generates signals earlier than SMA, but also produces more noise in sideways markets. When both SMA Cross and EMA Cross fire in the same direction you have a stronger consensus.
Best used on: All timeframes; especially useful on 15m–4h for swing entries
Combine with: SMA Crossover (double confirmation), Price Above SMA (trend context), ADX Strong Trend
3. RSI Oversold
Default weight: 6 | Direction: BUY | Default params: Window 14, Oversold level 30
The Relative Strength Index (RSI) measures the speed and size of recent price changes on a scale of 0–100. When RSI drops below 30, the asset has been sold off aggressively and a mean-reversion bounce may be due.
RSI uses Wilder smoothing — it takes more than 14 candles to fully initialise, which is why the scanner fetches 500 candles by default.
Important caveat: In strong downtrends, RSI can remain oversold for extended periods. An RSI 28 reading in a bearish Donchian breakout is very different from an RSI 28 at a support level after a healthy pullback.
Best used on: All timeframes
Combine with: BB Lower Touch (double oversold confirmation), Stochastic Buy (momentum crossover in oversold territory), Volume Spike (was there real selling volume behind the dip?)
4. RSI Overbought
Default weight: 6 | Direction: SELL | Default params: Window 14, Overbought level 70
The mirror of RSI Oversold. Fires when RSI climbs above 70, signalling that buying pressure may be exhausted. In strong uptrends price can remain overbought for many candles — the most reliable sell signals come when RSI turns back below the threshold rather than the moment it crosses above.
Combine with: BB Upper Touch, Stochastic Sell, Bearish Engulfing, MFI overbought
5. MACD Crossover
Default weight: 7 | Direction: BUY + SELL | Params: None (fixed EMA 12/26/9)
The MACD (Moving Average Convergence Divergence) consists of:
- MACD line: EMA(12) minus EMA(26)
- Signal line: EMA(9) of the MACD line
- Histogram: MACD minus Signal (not directly used by the scanner)
- BUY signal: MACD line crosses above the signal line — short-term momentum is accelerating upward
- SELL signal: MACD line crosses below the signal line — momentum is rolling over
MACD lags price (it’s built from lagging EMAs), making it better at confirming trend changes than predicting them. The highest-quality MACD signals occur when the crossover happens near the zero line, not deep in either direction.
Best used on: 1h and above; MACD is too noisy on 1m/5m
Combine with: EMA Crossover (same direction = strong confluence), RSI Momentum (is momentum still rising?), Volume Spike (volume confirmation)
6. BB Lower Touch (Bollinger Band)
Default weight: 6 | Direction: BUY | Default params: Window 20
Bollinger Bands are placed 2 standard deviations above and below a 20-period SMA. When price touches or closes below the lower band, it has moved into statistically unusual territory — roughly 95% of closes occur within the bands. This suggests the asset is oversold on a statistical basis and may revert toward the middle band.
Important: In strong downtrends, price can “walk the lower band” for many candles. This indicator requires context — use it in combination with a momentum signal to confirm the bounce is actually beginning.
Combine with: RSI Oversold, Stochastic Buy, Bullish Engulfing (reversal candle at the band)
7. BB Upper Touch (Bollinger Band)
Default weight: 6 | Direction: SELL | Default params: Window 20
Fires when price touches or closes above the upper Bollinger Band. This is a statistical outlier to the upside — a possible reversal back toward the mean. However, in strong breakouts price can remain above the upper band for multiple candles (band expansion). A Bolinger Upper Touch in a confirmed uptrend may actually be a continuation signal, not a reversal.
Combine with: RSI Overbought, Stochastic Sell, Bearish Engulfing
8. Stochastic Buy
Default weight: 6 | Direction: BUY | Default params: Window 14, Oversold level 20
The Stochastic oscillator compares the current close to the high-low range of the last N candles, producing %K (the raw value) and %D (a 3-period SMA of %K). This fires when:
- Both %K and %D are below the oversold level (20 by default)
- %K crosses above %D
The crossover requirement is important — it filters out cases where the oscillator is already deeply oversold and still falling. You want to see an actual turn, not just a depressed reading.
Combine with: RSI Oversold, Williams %R oversold, MFI oversold
9. Stochastic Sell
Default weight: 6 | Direction: SELL | Default params: Window 14, Overbought level 80
Mirror of Stochastic Buy. Fires when both %K and %D are above 80 and %K crosses below %D — momentum has peaked in stretched territory and is turning down.
Combine with: RSI Overbought, Williams %R overbought, MFI overbought, Bearish Engulfing
10. ADX Strong Trend
Default weight: 5 | Direction: BUY + SELL | Default params: Window 14, Threshold 25
The Average Directional Index (ADX) measures trend strength only — not direction. Scale of 0–100:
- Below 20: Ranging/choppy market — trend-following indicators unreliable
- 25–40: Moderate trend forming
- 40–60: Strong trend
- 60+: Very strong trend (rare in crypto)
When ADX is above the threshold (default 25), this indicator adds its weight to whichever side (buy or sell) is already leading from other indicators. It doesn’t create a direction on its own — it amplifies an existing signal.
Strategic tip: When ADX is below 20, consider disabling all crossover indicators (SMA, EMA, MACD) and relying more on mean-reversion indicators (BB Touch, RSI, Stochastic).
11. Price Above SMA
Default weight: 2 | Direction: BUY only | Default params: SMA Window 21
A simple context check: if the current close is above the rolling 21-period SMA, the short-term trend is up. Contributes half its weight (rounded down, so 1 point at default) to avoid overweighting what is a secondary confirmation. Intentionally designed as a mild BUY-only bias.
Not a standalone signal — use it as a low-weight background filter that tilts the score slightly in favour of the prevailing trend.
12. EMA Trend Filter
Default weight: 3 | Direction: BUY + SELL | Default params: Fast EMA 50, Slow EMA 200
The classic golden cross / death cross at the daily trader scale:
- EMA50 > EMA200: Long-term uptrend — buy signals carry more conviction
- EMA50 < EMA200: Long-term downtrend — sell signals carry more conviction
This is one of the most widely followed long-term trend indicators in all markets. A BUY signal from RSI Oversold while EMA50 is above EMA200 (trend alignment) is significantly more reliable than the same signal with bearish EMA trend.
Requires at least 200 candles of history — the scanner’s 500-candle fetch handles this comfortably.
Best used on: 1h and above (200 EMA on 1m or 5m requires very long history and is rarely meaningful)
📊 Oscillator & Momentum Indicators
13. Williams %R
Default weight: 5 | Direction: BUY + SELL | Default params: Window 14, Oversold 80, Overbought 20
Williams %R is a fast momentum oscillator ranging from -100 to 0. It measures where the current close sits within the high-low range — similar to Stochastic %K but without smoothing, making it more reactive.
- Below -80 (UI shows as 80): Oversold — BUY signal
- Above -20 (UI shows as 20): Overbought — SELL signal
Because it has no smoothing it reacts instantly to price action, catching short-term exhaustion points before RSI or Stochastic respond. The trade-off is more noise on short timeframes.
Combine with: RSI Oversold/Overbought (slow + fast oscillator agreement), Stochastic (smoothed vs raw confirmation)
14. CCI (Commodity Channel Index)
Default weight: 4 | Direction: BUY + SELL | Default params: Window 20, Threshold ±100
CCI measures how far the typical price (High + Low + Close / 3) has deviated from its rolling average, normalised by mean absolute deviation:
- CCI < -100: Unusually depressed — BUY signal
- CCI > +100: Unusually elevated — SELL signal
Unlike RSI and Stochastic, CCI has no fixed upper or lower bound. Extreme readings of ±200 or ±300 carry extra significance. CCI is particularly effective at identifying cyclical turning points and divergences between price and momentum.
Combine with: RSI Oversold/Overbought, MFI Signal
15. Volume Spike
Default weight: 5 | Direction: BUY + SELL | Default params: Window 20, Multiplier 1.5x
Compares the current candle’s volume to the rolling average volume. When volume exceeds the average by the configured multiplier (default 1.5×), it confirms that real market participation is behind the current move — distinguishing a genuine breakout from a low-liquidity drift.
Important: Volume Spike alone without other directional signals contributes nothing — the weight is added to whichever side (buy or sell) is already leading. Use it to amplify signals, not create them.
Combine with: Donchian Breakout (volume confirming a channel breakout is the classic setup), MACD Crossover, any directional indicator
16. ATR Volatility Filter
Default weight: 0 | Acts as a gate, not a scorer | Default params: Window 14, Min threshold 0.5%
Average True Range (ATR) measures volatility by averaging the true range (largest of: high–low, high–previous close, low–previous close) using Wilder smoothing.
In the scanner, ATR acts as a noise filter not a scoring indicator. If the current ATR as a percentage of price is below the minimum threshold (default 0.5%), the pair is skipped entirely as likely dead, illiquid, or stuck — any indicator signals it generates would be unreliable.
ATR value is also shown in the results table for reference. Default weight is 0, meaning it never contributes to scores directly — you can raise the weight if you want to actively reward volatile setups.
🕯️ Candlestick Pattern Indicators
17. Bullish Engulfing
Default weight: 6 | Direction: BUY | Params: None
A classic two-candle reversal pattern:
- Candle 1: Bearish (close < open)
- Candle 2: Bullish (close > open) with a body that completely engulfs candle 1 — candle 2’s close ≥ candle 1’s open, and candle 2’s open ≤ candle 1’s close
This means buyers fully overwhelmed the prior session’s sellers in a single candle — a strong momentum shift. Most reliable after a sustained downtrend or at a well-established support level. In the middle of a range it carries less weight.
Combine with: RSI Oversold, BB Lower Touch (pattern occurring at an extreme), Volume Spike (big engulfing candle with above-average volume is a powerful setup)
18. Bearish Engulfing
Default weight: 6 | Direction: SELL | Params: None
Mirror of Bullish Engulfing. The second candle is bearish and completely engulfs the first bullish candle — sellers overwhelmed buyers in a single session. Most effective after a sustained rally or near resistance.
Combine with: RSI Overbought, BB Upper Touch, Volume Spike
📈 Advanced Momentum Indicators
19. RSI Momentum
Default weight: 3 | Direction: BUY + SELL | Default params: Slope window 5
Where RSI Oversold/Overbought looks at absolute RSI levels, RSI Momentum looks at which way RSI is moving:
- Rising RSI over 5 bars: Momentum building upward — BUY signal
- Falling RSI over 5 bars: Momentum weakening — SELL signal
This fires regardless of the current RSI level, catching early momentum shifts before the oversold/overbought thresholds are reached. An RSI rising from 45 to 52 fires this indicator even though neither level is extreme.
Combine with: RSI Oversold (level + direction = double confirmation), MACD Crossover (both momentum measures agree)
20. VWAP Cross
Default weight: 7 | Direction: BUY + SELL | Params: None (auto-calculated)
VWAP (Volume-Weighted Average Price) is the cumulative average price weighted by volume, resetting at each UTC day boundary. It represents the true average price paid by all participants during the day.
- Price crosses above VWAP: Buyers have reclaimed the daily average — BUY signal
- Price crosses below VWAP: Sellers have taken control — SELL signal
VWAP is the single most important intraday reference level used by institutional traders. A cross above VWAP on strong volume is one of the highest-quality intraday setups.
Best used on: 1m, 5m, 15m, 1h — on daily candles each bar is its own day so VWAP equals typical price and loses meaning. Consider disabling on 1d timeframe.
Combine with: Volume Spike (VWAP cross on above-average volume), OBV Momentum (institutional accumulation accompanying the cross)
📦 Volume Flow Indicators
Note: OBV Momentum, A/D Line Momentum, and CMF Signal all use volume data. The scanner applies diminishing returns to the second and third of these — the 2nd gets 50% of its weight, the 3rd gets 50% of the 2nd — preventing volume flow from dominating scores simply because three indicators share the same underlying data.
21. OBV Momentum
Default weight: 4 | Direction: BUY + SELL | Default params: Slope window 8
On Balance Volume (OBV) adds full volume on up-candles and subtracts full volume on down-candles, creating a cumulative line. The absolute value is arbitrary — only its direction matters. This indicator measures the OBV slope over 8 bars:
- Rising OBV: Institutional accumulation is occurring (smart money buying even if price is flat) — BUY
- Falling OBV: Distribution is occurring — SELL
OBV divergence from price is one of the most reliable leading signals in technical analysis: if price is making new highs but OBV is falling, the rally lacks volume support and is likely to reverse.
22. A/D Line Momentum (Accumulation/Distribution)
Default weight: 3 | Direction: BUY + SELL | Default params: Slope window 8
The A/D Line improves on OBV by weighting volume by how the candle closed within its range:
Money Flow Multiplier = (2×Close − High − Low) / (High − Low)
A close at the top of the range = +1× volume (strong accumulation). A close at the bottom = −1× volume (strong distribution). This means a green candle closing near its low is correctly counted as partial distribution — OBV would count it as pure accumulation. Measures the A/D slope over 8 bars.
Best used with: OBV Momentum — when both agree the signal is significantly stronger; when they disagree, caution is warranted.
23. CMF — Chaikin Money Flow
Default weight: 4 | Direction: BUY + SELL | Default params: Window 20
CMF normalises the A/D Line into a bounded oscillator by dividing the sum of money flow volume over the window by total volume over the same window. This removes the cumulative drift of the raw A/D line.
- CMF > 0: Net accumulation — BUY signal
- CMF < 0: Net distribution — SELL signal
- CMF > +0.25 or < -0.25: Strong signal
The bounded nature makes CMF easy to compare across different pairs and timeframes, unlike the raw A/D line whose scale varies by market cap.
🚀 Breakout & Trend-Following Indicators
24. Donchian Channel Breakout
Default weight: 7 | Direction: BUY + SELL | Default params: Window 20
Donchian Channels track the highest high and lowest low of the last N candles. A breakout fires on the first candle that closes above the upper channel (BUY) or below the lower channel (SELL).
Unlike Bollinger Bands, Donchian channels use raw price extremes with no statistical weighting. This makes them excellent at catching genuine momentum breakouts in trending markets — the signal fires when price has actually made a new N-bar high or low, not just moved 2 standard deviations from a mean.
A Donchian breakout is the foundation of many systematic trend-following strategies (Turtle Trading being the most famous).
Combine with: Volume Spike (breakout on above-average volume = conviction), ADX Strong Trend (avoid false breakouts in ranging markets)
25. MFI — Money Flow Index
Default weight: 7 | Direction: BUY + SELL | Default params: Window 14, Oversold 20, Overbought 80
MFI is volume-weighted RSI. It uses the typical price (H+L+C)/3 and weights each bar by its volume before computing the RSI calculation:
- MFI < 20: Oversold with volume confirmation — BUY signal
- MFI > 80: Overbought with volume confirmation — SELL signal
Because it incorporates volume, MFI is harder to fake by price alone. A high MFI oversold reading means not only is price depressed but there was genuine selling volume behind it — making the potential reversal more meaningful. In crypto markets where wash trading is common, volume-weighted indicators offer an edge.
Combine with: RSI Oversold/Overbought (RSI + MFI both oversold = strong setup), Stochastic (three oscillators agreeing = rare but high conviction)
26. Supertrend
Default weight: 8 | Direction: BUY + SELL | Default params: ATR Period 10, Multiplier 3×
Supertrend is an ATR-based trend-following indicator that draws a dynamic band above or below price:
- Bullish: Band is below price, acting as support
- Bearish: Band is above price, acting as resistance
The scanner scores only on the flip candle — the moment the trend changes direction — not on every candle within a trend. This means it fires infrequently but when it does, it’s a significant event: price has broken through the ATR-based band and reversed the established trend.
Parameters:
- st_period (default 10): ATR lookback for band width calculation
- st_multiplier (default 3 = 3.0×): How many ATRs wide the band is. Lower = more sensitive, more signals; higher = less sensitive, fewer but higher-quality signals
With the highest default weight of any indicator (8), a Supertrend flip alongside RSI + MACD confirmation is one of the strongest combined signals the scanner can produce.
Combine with: MACD Crossover (momentum confirmation of the trend flip), EMA Trend Filter (is the flip aligned with the longer-term trend?), Volume Spike
🔧 Indicator Combinations — Preset Strategies
The Conservative Swing Setup (higher timeframes, 4h/1d)
Enable: EMA Trend Filter + ADX Strong Trend + MACD Crossover + RSI Oversold/Overbought + Supertrend + Volume Spike
Look for Strength% > 70%, Conviction% > 75%. Ignore signals where EMA Trend Filter and MACD disagree on direction.
The Intraday Momentum Setup (1h/15m)
Enable: VWAP Cross + EMA Crossover + RSI Momentum + OBV Momentum + Volume Spike + Stochastic Buy/Sell
VWAP Cross carries the most weight here. A VWAP reclaim with rising OBV and expanding volume is the intraday momentum trader’s bread and butter.
The Mean Reversion Setup (any timeframe)
Enable: BB Lower/Upper Touch + RSI Oversold/Overbought + Stochastic Buy/Sell + Williams %R + CCI + MFI Signal
Disable: SMA/EMA Crossover, Donchian Breakout, Supertrend (trend-following indicators work against mean-reversion logic)
Look for 4+ of these firing simultaneously. A confluence of 5 oversold indicators on the same pair is a very high-probability mean-reversion setup.
The Breakout Setup
Enable: Donchian Breakout + Volume Spike + ADX Strong Trend + Supertrend + EMA Trend Filter
Donchian fires first. If ADX is already rising above 25 and volume is expanding, the breakout has real participation behind it.
Tips for Getting the Most From the Scanner
- Multi-Timeframe confirmation is the biggest edge: A BUY signal on 1h + 4h + 1d simultaneously means all three time horizons agree. The scanner surfaces these automatically with gold highlighting and sorts them to the top.
- Strength% tells you how much fired. Conviction% tells you how clearly it won. High Strength + High Conviction = high-probability setup. High Strength + Low Conviction = lots of indicators fired but both sides lit up — choppy/ranging market, treat with caution.
- ATR Filter is your quality gate. If a pair has very low ATR it’s dead — even a technically perfect signal is unreliable in a ticker with no liquidity. Keep it enabled.
- Volume Spike is not a standalone signal — always pair it with at least one directional indicator. Think of it as a multiplier, not a generator.
- Supertrend fires rarely — when it does, pay attention. It’s the one indicator with the highest weight for good reason.
Get Started
Ready to put all 27 indicators to work?
DOWNLOAD TA SIGNAL SCANNER: https://cryptobots.dev/scripts/technical-analysis-signal-scanner-free/
STARTERS GUIDE: https://cryptobots.dev/articles/signal-scanner-starters-guide
Disclaimer: This guide is for educational purposes only and does not constitute financial advice. Technical indicators are tools, not guarantees. Always use proper risk management.
CryptoBots Signal Scanner — 27 indicators. One score. Your edge.
/// To contact us on Telegram use the link below: